Remote operation. How should an operator supervising self-driving trucks stay in the loop without being overloaded?

From before ATTO: master's thesis at Einride, 2023

Remote operation sits at a fragile intersection: an operator at a desk, an autonomous system, and a real truck moving through traffic shared with everyone else. Get the interface wrong and the operator misses what matters; get it wrong often enough and the whole industry is held back. Over half a year, my thesis partner and I researched, mapped and prototyped the operator's interface, and wrote guidelines for designing others like it.

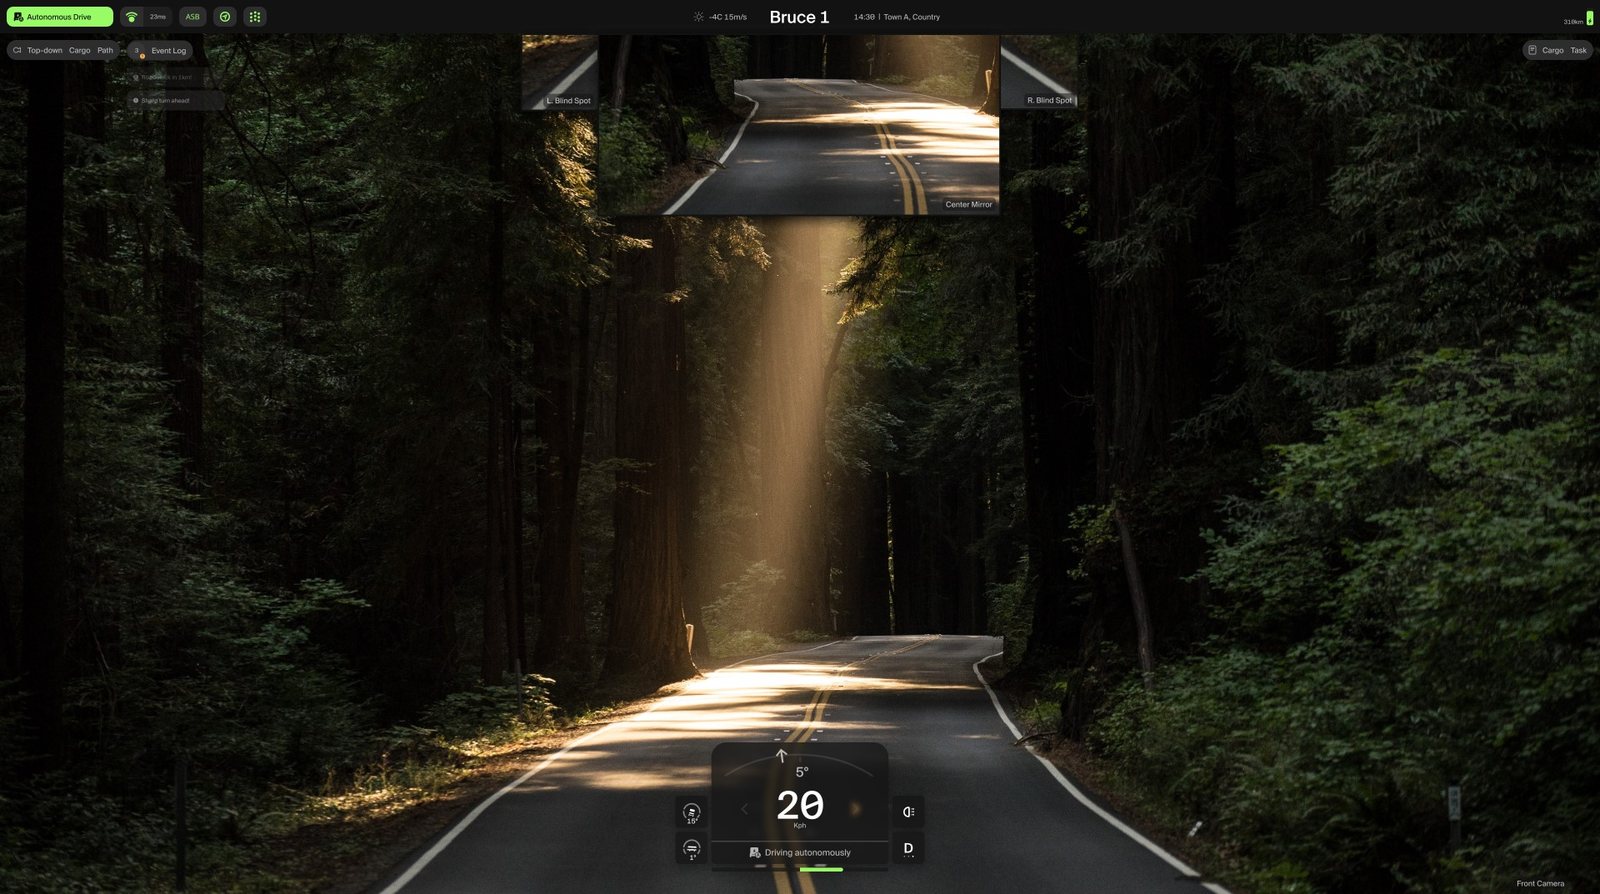
The final operator view: the road ahead from the truck, mirrors above, speed and drive mode below.
Operator view. Simulated road, not a live truck.

Three decisions

Decision 1 of 3

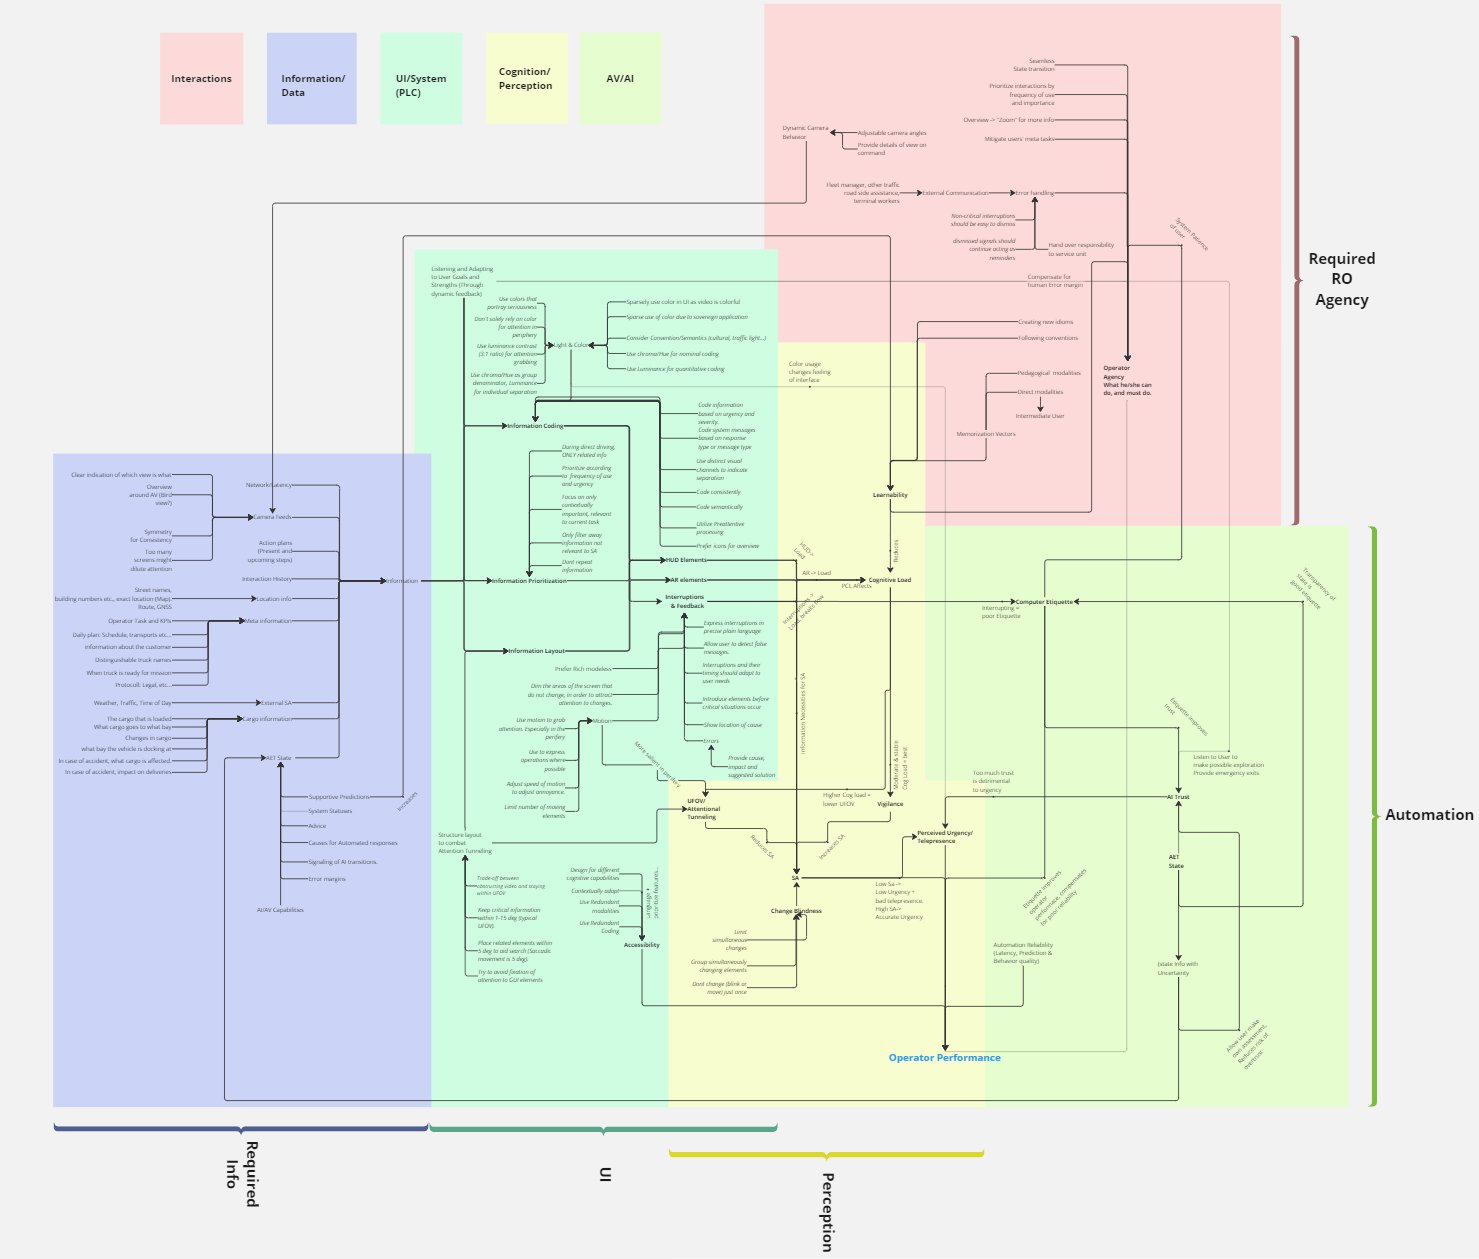
Systems map: concepts in five coloured domains, connected by arrows meaning “affects”.
Systems map, an arrow means "affects"

Map the system, not the themes

We placed one goal at the centre, operator performance, and drew how every finding affects it and each other. Every later design choice could be traced back to a node on this map, and the map became our guidelines.

Rejected
An affinity diagram: sorting findings into clusters. Its strict hierarchy hid the relationships.
Why
The problem was not a list of themes but a network of forces acting on each other.
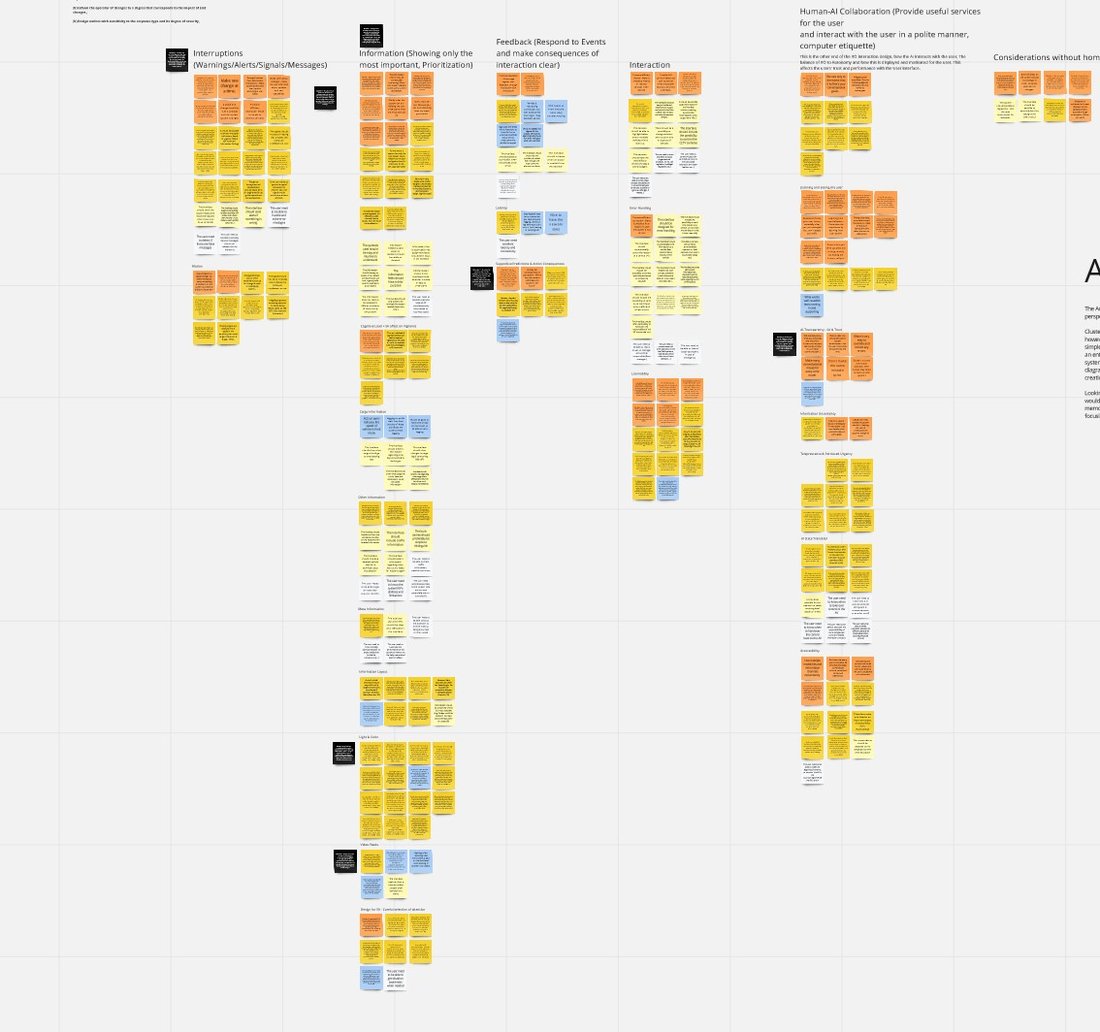
Affinity diagram of colour-coded notes, sorted into clusters.
The affinity diagram we moved on from

Decision 2 of 3

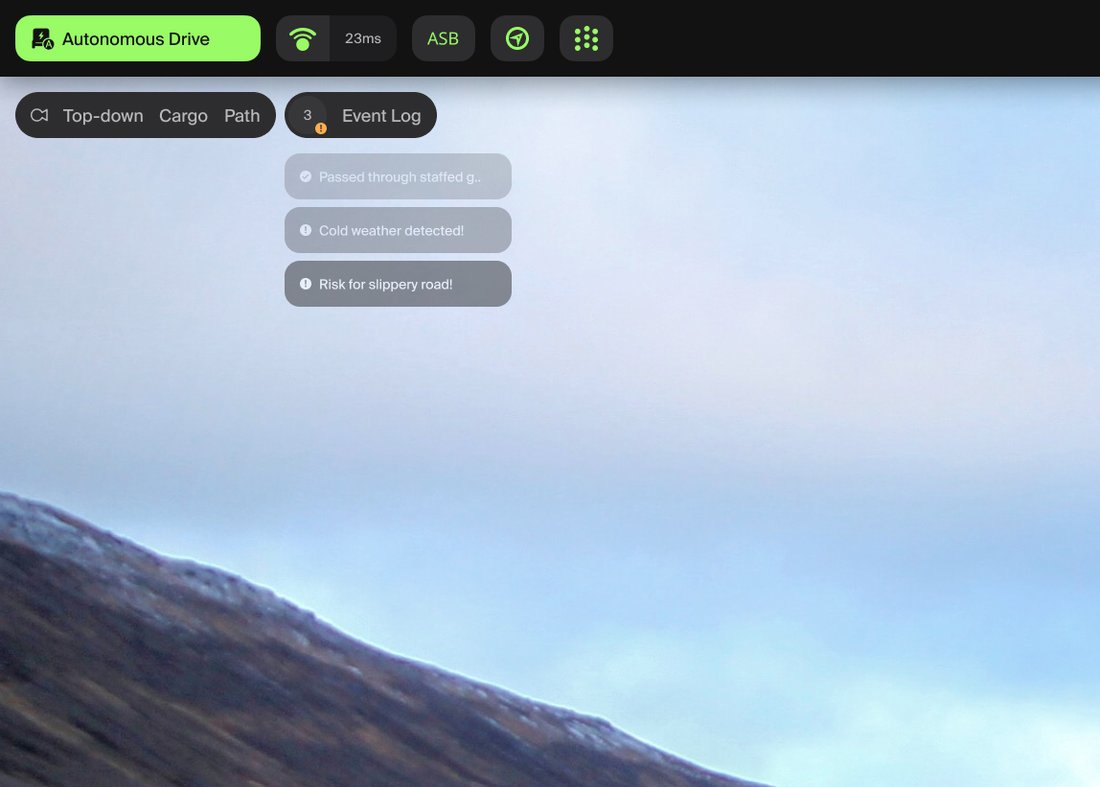
Operator view with the event log collapsed into a few quiet lines.
The log collapsed

Quiet until it matters

The event log can collapse, so it asks for attention only when something important happens and stays out of the way the rest of the time.

Rejected
Signalling urgency mainly with colour. In early versions so much was coloured that nothing stood out.
Why
An operator who is interrupted all the time stops noticing; one who is never interrupted misses the moment.

Decision 3 of 3

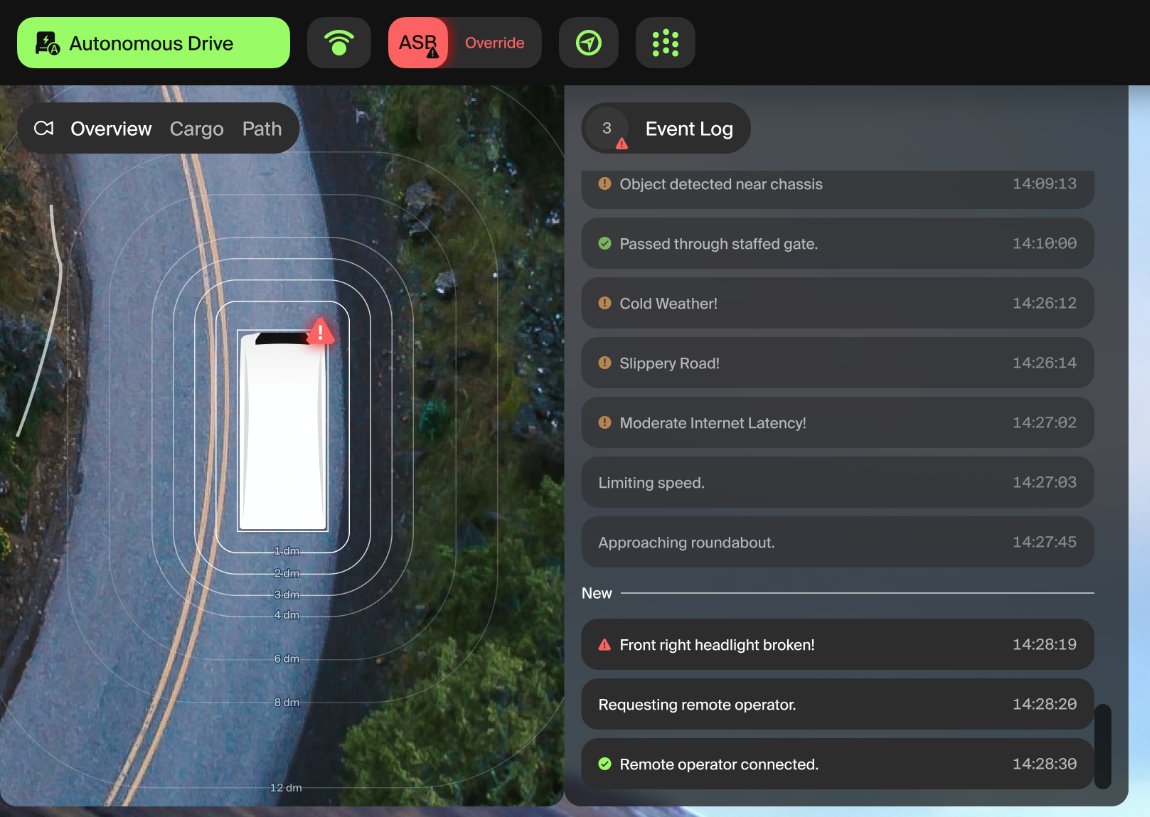
Top-down view of the truck on a curved road with a damaged part marked on the vehicle, and the event log beside it.
A fault, shown on the truck itself

Show problems where they are

A top-down view of the truck anchors each warning to its physical location, following "overview first, details on demand". Symbols carry the meaning; text only where text is genuinely best.

Rejected
Text-first lists of alerts, read line by line.
Why
The eye finds a mark on a picture faster than it reads a sentence, and a calm, located warning keeps stress down during a takeover.

Result

Calm by default, clear when it counts.

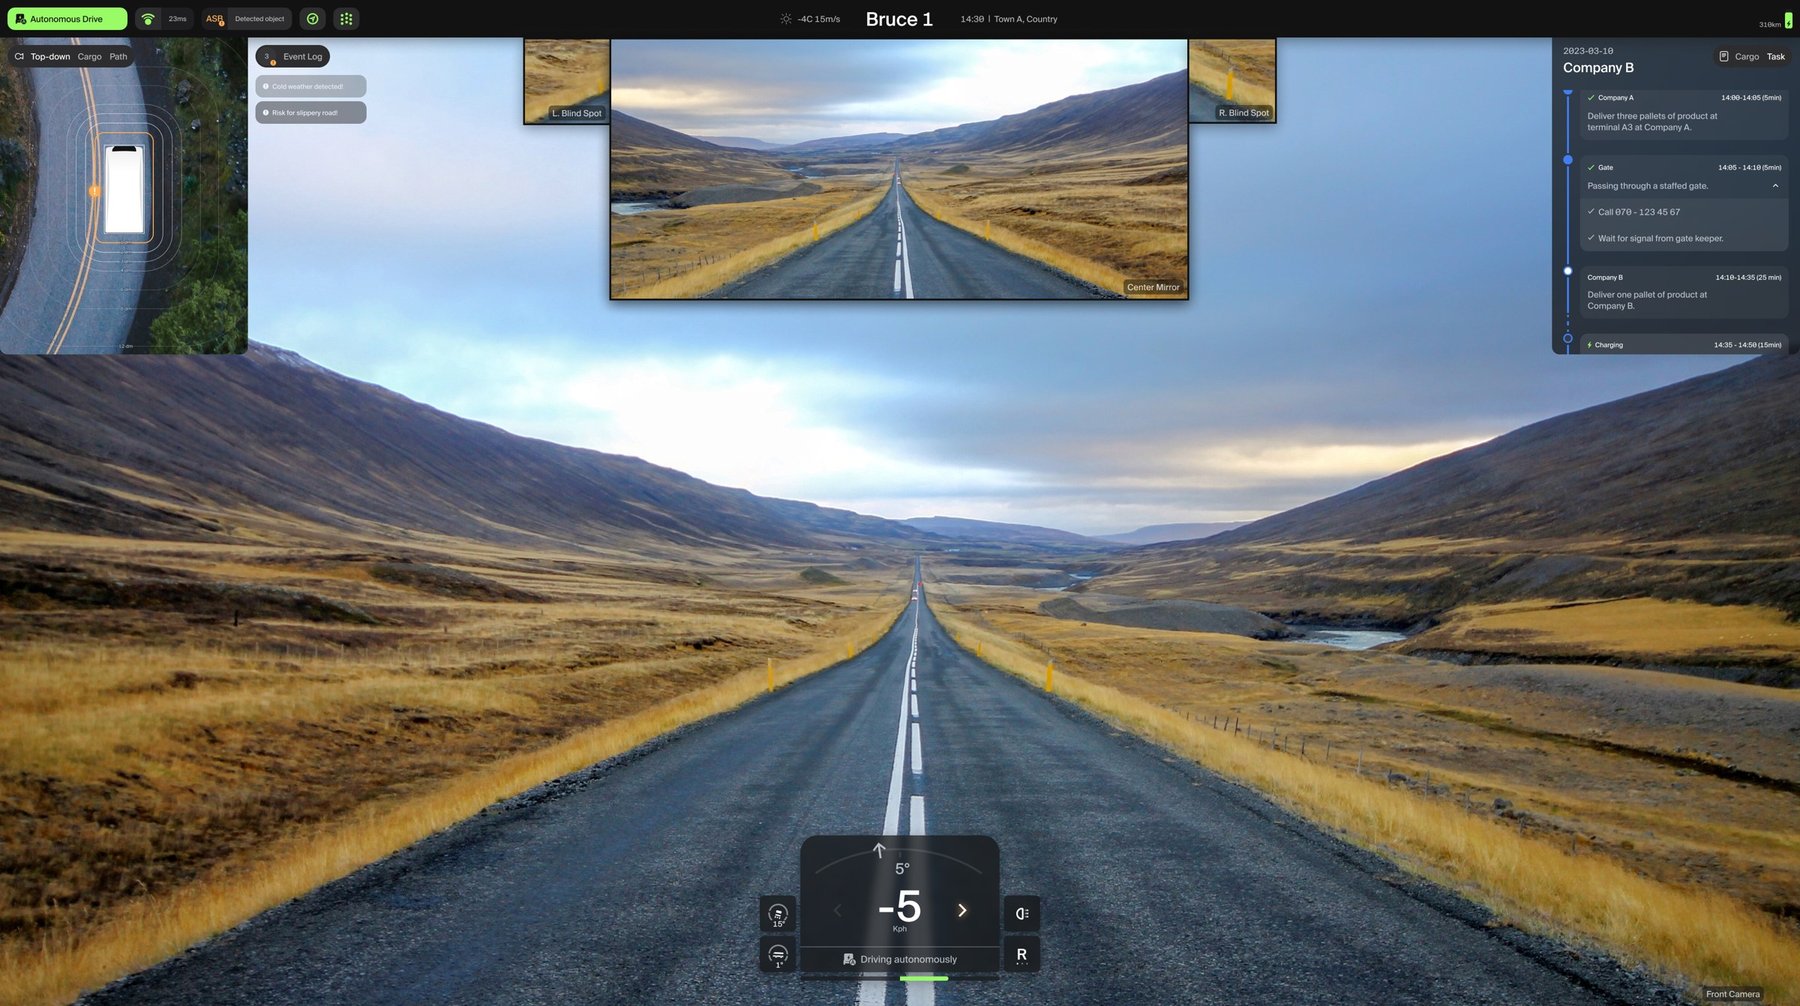
The final interface on a wide screen: road view in the centre, panels for cargo, tasks and the event log around it.
The final interface. Simulated road, not a live truck.

Outcome

The design became an interactive prototype in React, evaluated with Einride's stakeholders, and a set of guidelines for designing remote operation interfaces, built on the systems map.

Read the full thesis ↗︎

← Go back

Contact

Let’s talk →

A free first conversation, about 45 minutes. Or write to hello@attofoundry.se